The Hammer Candlestick Pattern: Your Friendly Guide to Spotting Trend Reversals
Introduction
Have you ever wondered how traders seem to predict market reversals before they happen? Much like how a weather vane hints at a change in the wind, the hammer candlestick pattern serves as a crucial indicator of shifting momentum in financial markets. In this article, we’ll journey into the world of candlesticks, demystifying the double hammer candlestick pattern, exploring the unique inverted hammer candlestick pattern, and showing how auto trading software brings these patterns alive in your trading strategy.
Learn about the double hammer candlestick pattern, inverted hammer candlestick pattern, and how auto trading software can help you trade smarter and easier.
What is a Hammer Candlestick Pattern?
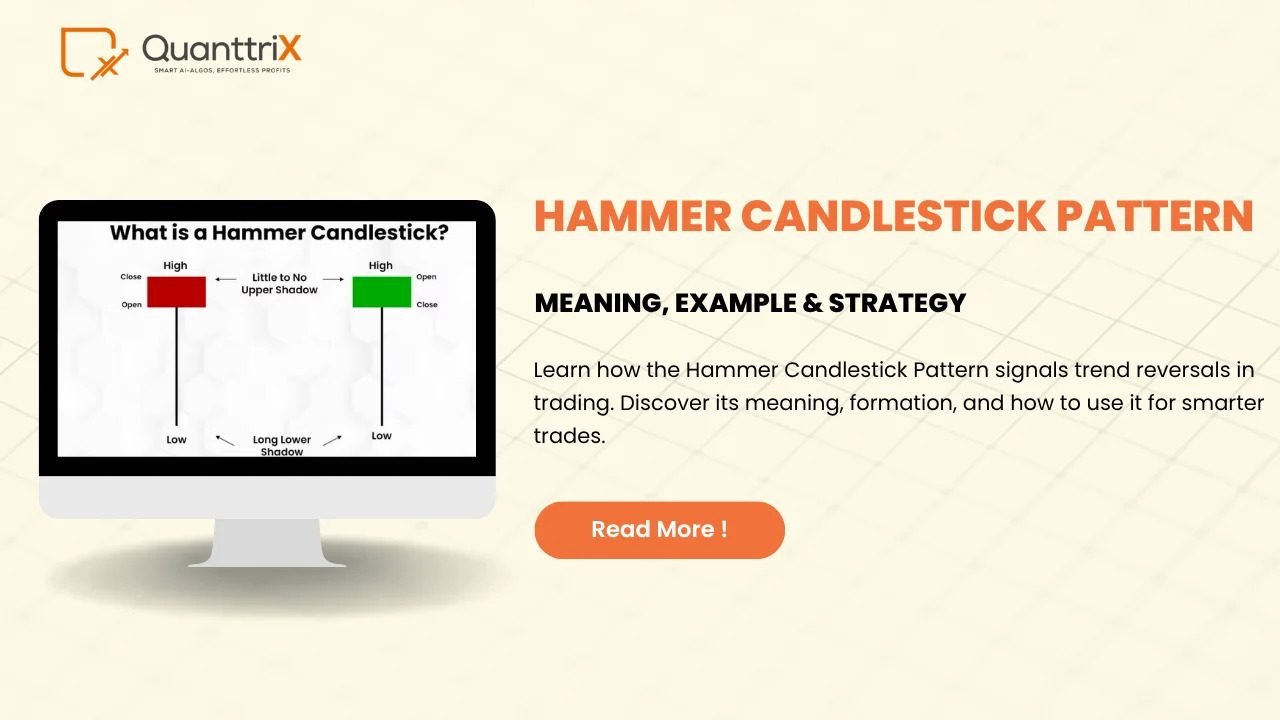
The hammer candlestick pattern occurs when a single candle appears at the bottom of a downtrend, resembling the shape of a hammer—small body at the top with a long lower wick, and little or no upper wick. Its formation signals the possibility that buyers are gaining the upper hand after significant selling pressure.
Anatomy of a Hammer: Breaking Down the Parts
A typical hammer candlestick has:
- A small real body (the range between the open and close) near the top of the candle.
- Long lower shadow—at least twice as long as the body—showing price was pushed down but buyers brought it back up.
- Little or no upper shadow, indicating buyers kept control near the closing.
This unique structure visualizes a tug-of-war, with sellers initially pushing the price down but ultimately losing out as buyers snap up the asset at lower prices.
Why Do Hammer Patterns Matter?
Hammers signal potential bullish reversals. When you spot one after a series of price drops, it’s a hint that the tide may be turning, and a new uptrend could be around the corner. They don’t guarantee success, but serve as valuable early warnings for alert traders.
Spotting the Hammer: Key Identification Tips
- Look for a small body near the top of the range.
- Confirm that the lower wick is at least twice the body length.
- Ensure the candle forms after a downtrend—context is crucial.
- Check for little or no upper shadow.
- Seek confirmation with a bullish candle following the hammer—this strengthens the reversal signal.
The Double Hammer Candlestick Pattern
The double hammer candlestick pattern is a rare but robust signal. It occurs when two hammer candlesticks form in succession at the bottom of a downtrend. This back-to-back rejection of lower prices by the market serves as a strong sign that buyers are returning, and the decline may be ending. Traders view this pattern as a powerful bullish reversal cue, as it demonstrates sellers tried twice to push prices lower but failed both times.
Inverted Hammer Candlestick Pattern Explained
Unlike the traditional hammer, the inverted hammer candlestick pattern has its small body at the bottom and a long upper wick. The lower wick is minimal or absent. This pattern appears at the bottom of a downtrend and signals a potential reversal. The extended upper shadow suggests buyers attempted to push prices up, and although they didn’t fully succeed, their presence signals a possible shift away from selling pressure.
Comparing Hammer and Inverted Hammer
Feature | Hammer Candlestick | Inverted Hammer Candlestick |
Shape | Body at the top, long lower wick | Body at the bottom, long upper wick |
Signals | Bullish reversal after a downtrend | Bullish reversal after a downtrend |
Shadow/Wick | Lower shadow ≥ 2x body, no upper shadow | Upper shadow ≥ 2x body, little/none below |
Where it Appears | Bottom of a downtrend | Bottom of a downtrend |
Trading Psychology: What Hammers Reveal
Think of the hammer as a battlefield where sellers rush the price downward, only for buyers to mount a surprising comeback by the end of the session. This emotional “whiplash” can shake out weak sellers and attract opportunistic buyers, setting the stage for a change in momentum.
Practical Uses – When to Act on Hammer Signals
- Use hammers to spot reversal opportunities—especially when combined with volume spikes or support zones.
- Always wait for confirmation from the next candle before entering a trade.
- Combine with other technical tools (like moving averages or RSI) to boost reliability.
Chart Examples and Visualizations
While we can’t insert actual charts here, many trading platforms highlight these patterns directly, and you’ll find that hammers stand out visually due to their distinctive shape.
Limitations of Hammer Patterns
While powerful, the hammer is not foolproof:
- Not all hammers lead to reversals—some are false signals.
- Context matters: They work best after a clear downtrend.
- Always wait for post-hammer confirmation.
- Don’t ignore broader trends or market news that may override technical signals.
Integrating Hammer Patterns with Auto Trading Software
In today’s fast-paced markets, traders use auto trading software to spot hammer and inverted hammer patterns in real time. These programs scan charts 24/7, alerting traders or executing trades based on pre-set criteria.
Benefits include:
- Speed: No human can scan hundreds of charts as quickly as software.
- Consistency: The rules are followed every time, cutting out emotion.
- Backtesting: Test if hammer-based strategies work on past data before risking real money.
Top Auto Trading Software for Candlestick Trading
Some leading platforms that support candlestick recognition and pattern-based trading include:
- MT4 (MetaTrader 4): Popular globally with customizable indicators and automated trading bots.
- NinjaTrader: Offers strategy automation, backtesting, and extensive analytics.
- TradeStation: Easy to use, script-driven, and powerful for both new and advanced traders.
- AlgoTest: Renowned in India for drag-and-drop strategy building, backtesting, and auto-execution without coding.
- SpeedBot: Modern, cloud-based, no-code solution offering retail and quant traders prebuilt candlestick and price action templates.
These platforms help bring technical analysis like the hammer and inverted hammer into automated, real-time use.
Key Do’s and Don’ts: Avoiding Common Pitfalls
Do:
- Confirm with other indicators and trend analysis.
- Use stop-loss orders to manage risk.
- Study plenty of examples to build visual recognition.
Don’t:
- Rush into trades based on a single candle without confirmation.
- Ignore market news that could affect price direction.
- Rely on hammer patterns alone—make them part of a broader strategy.
Conclusion: Harnessing Hammer Power
The hammer candlestick pattern—and its siblings, the double hammer and inverted hammer candlestick patterns—stand out as essential tools for any trader interested in spotting and acting on trend reversals. But their real magic comes when paired with sound judgment, proper confirmation, and the steady hand of auto trading software. Just like a skilled carpenter chooses the right tool for each job, a smart trader wields hammer patterns to build a solid foundation for trading success.
Frequently Asked Questions (FAQs)
- What is the difference between the hammer and inverted hammer candlestick patterns?
The hammer has a small body at the top and a long lower wick, signaling bullish reversal after a downtrend. The inverted hammer has a long upper wick and small body at the bottom, also signaling possible bullish reversal but with a different price action dynamic. - Is the double hammer candlestick pattern more reliable than a single hammer?
Generally, the double hammer pattern is considered stronger, as two consecutive hammers show repeated buyer strength, increasing the likelihood of a reversal. - Can auto trading software spot hammer and inverted hammer patterns?
Yes! Many top auto trading platforms can automatically scan for and trade these patterns, bringing more speed and consistency to your strategy. - Are hammer candlestick patterns foolproof signals?
No. Any technical pattern can fail. Always seek confirmation, use in conjunction with other analysis, and manage risk to avoid false signals. - Should beginners use hammer patterns in live trading?
Yes, but with caution. Practice identifying patterns in demo accounts first or use auto trading software with small amounts until you’re comfortable.
By understanding and using the hammer candlestick pattern, along with its variations like the double hammer and inverted hammer, and leveraging auto trading software, you’re equipping yourself with a versatile toolkit for smarter, more confident trades.